ArcBase
Select the Sector command in the Draw menu
or left-click the Sector command button ![]() in the toolbar; move the mouse to the screen editing window, and
then it will become a cross, which means you can draw a pie chart in the screen
now. As shown in Figure 4-35:
in the toolbar; move the mouse to the screen editing window, and
then it will become a cross, which means you can draw a pie chart in the screen
now. As shown in Figure 4-35:
Figure 4-35 Sector Operation
Move the mouse to any point of the green dots in the middle of the
rectangle, then the mouse will change to the shape ![]() ; change the arc of the sector by moving th
emouse.
; change the arc of the sector by moving th
emouse.
Dynamic Color
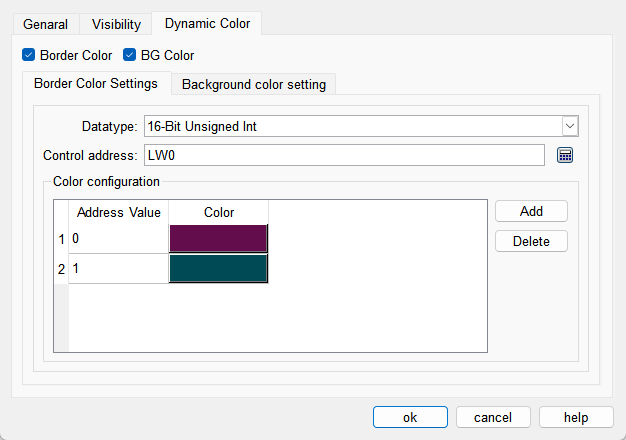
The colors of border and background can be changed by modifying the values of the corresponding registers. You need to check the corresponding option to enable the dynamic color function.
l Data Type: Set the data type of the register.
l Control Address: Set the address of the register that controls color changes.
l Color Configuration: Multiple values and their corresponding colors can be configured. When the value of the register corresponding to the control address matches one of the configured values, the corresponding color will be displayed. (If the register value does not match any of the configured values, the color set in the configuration will be displayed.)