1. Timing diagram
1. Timing diagram
A time series diagram is a historical record of numerical changes, plotted as curves in a coordinate system.
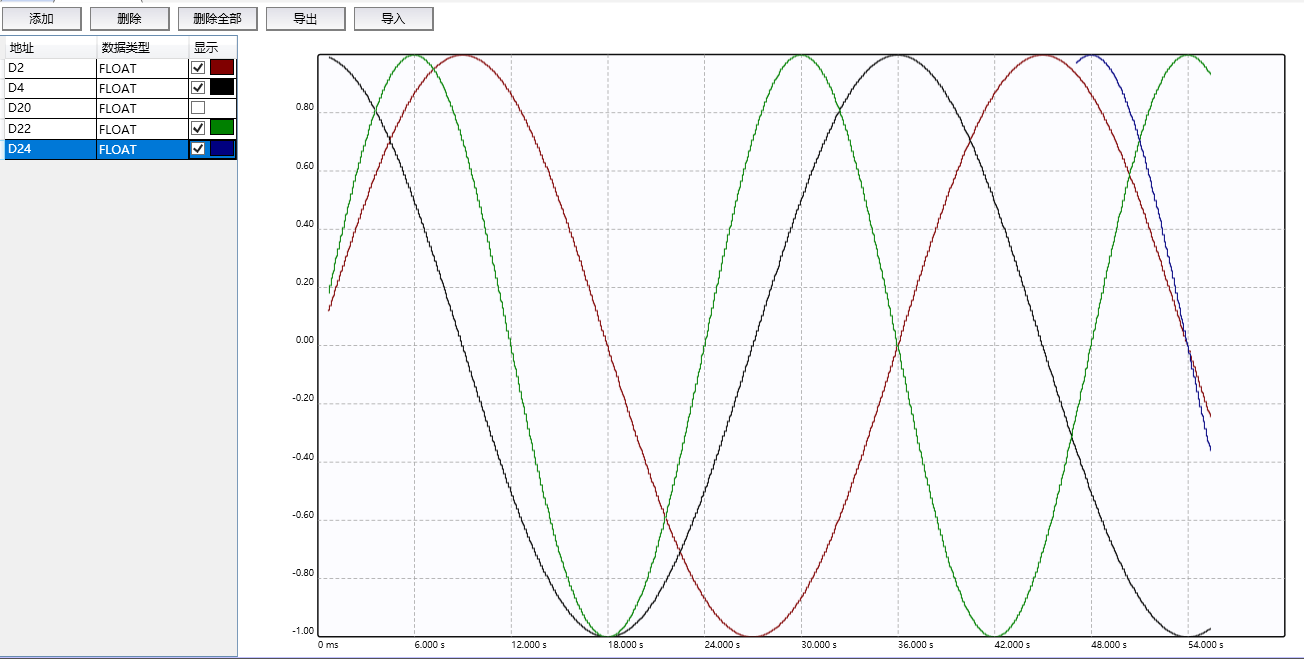
图1 Timing Chart
1.1. Open the window
To view the Engineering Explorer (if not displayed), please follow these steps:
Click the down arrow under the Window button in the Windows section of the View menu.
Click on 'Diagram' in the drop-down menu.
This window is docked in the center and cannot be dragged as a floating window.
1.2. Add one or more software components
Click the 'Add' button to enter the add wizard. Perform the following steps in sequence:
Check 'Start drawing the timing diagram for one (multiple) software components'.
Set the software component address and data type.
If you want to add multiple software components continuously, check "Batch Add" and enter the quantity.
Click on 'Next'.
Click 'Finish' on the completion window.。
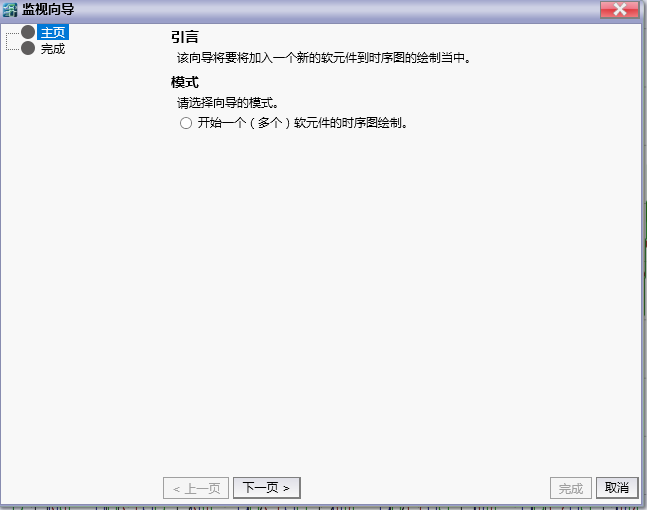
图2 Add guide
1.3. Delete one or more software components
Perform the following steps in sequence:
Select the software component to be deleted from the table on the left.
Click the 'Delete' button.
If you want to delete all software components, click "Delete All".
1.4. Reduce or enlarge the viewport
*Enter the left column ruler of the coordinate system with the mouse, scroll up to zoom out, and down to zoom in.
*Enter the horizontal ruler on the lower side of the coordinate system with the mouse, scroll up to zoom out, and down to zoom in.