1. Monitoring List
1. Monitoring List
Set up some software components in the monitoring list to view real-time numerical changes in the monitoring status.
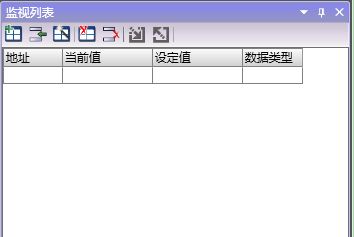
图1 monitor list
1.1. Open the window
To view the Engineering Explorer (if not displayed), please follow these steps:
Click the down arrow under the Window button in the Windows section of the View menu.
Click on 'Monitor table' in the drop-down menu.
When entering simulation or monitoring mode, the window layout before exiting this mode will be applied, and the monitoring list window will be displayed.
The monitoring list defaults vertically to the right to display more values. Canadjust window。
1.2. Default table
The monitoring list has at least one sub table, which is the default table.
1.3. New Table (General Table)
After creating the project, a new table is automatically added.
*You can add, rename, or delete any of these tables.
*Software components can be added and removed freely in this table, without affecting the properties and program logic of the software components themselves.
1.4. Function button
After creating the project, a new table is automatically added.
| Icon | Name | Function |
|---|---|---|
 |
Create a new table | Create a new generic table. |
 |
Insert row | Insert a new row at the selected position |
 |
Guide | Guide to achieve more operations |
 |
Delete table | Delete the currently open generic table, note that the default table cannot be deleted |
 |
Delete line | Delete the row where the selected position is located |
 |
import | Import external data into the monitoring list. |
 |
Export | Export the current table as external data. |